Published: May 6, 2020 by SPAMLab
In May 2020, despite all the limitations we were all facing during the COVID-19 global pandemic, our friends at São Paulo City Hall managed to release a new dataset of the city’s LiDAR survey. While the first release “only” had the ground-classified points, this one has the full point clouds, with all LiDAR returns. And the points are colored based on high-resolution orthophotos!
To download the data, check this other post.
In this post I want to show the nice 3D viewer they implemented, based on Potree and the Entwine Point Tile (EPT).
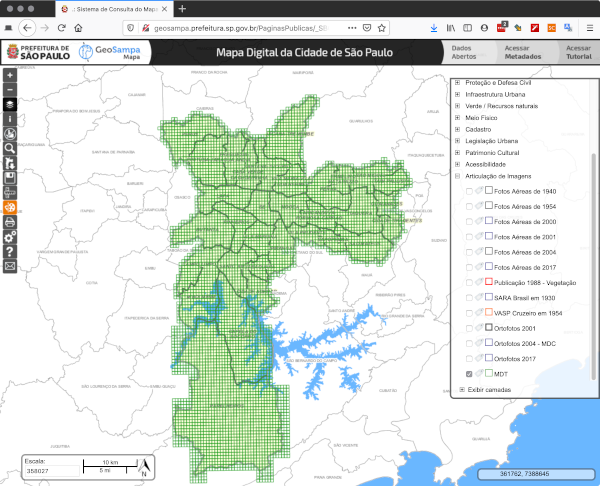
First, head to http://geosampa.prefeitura.sp.gov.br. The city limits will be displayed in the center, with a base map showing the limits of the neighboring cities and the districts of São Paulo in a thicker outline. The menu panel on the right side has the available layers, and the toolbar on the left has, well, the tools to navigate, query, etc.
Scroll down the layers list on the right to the last item, “Articulação de Imagens” (Images Tiling) and select “MDT/MDS 2017”.
 |
|---|
| GeoSampa interface with LiDAR tiles in green (click to enlarge) |
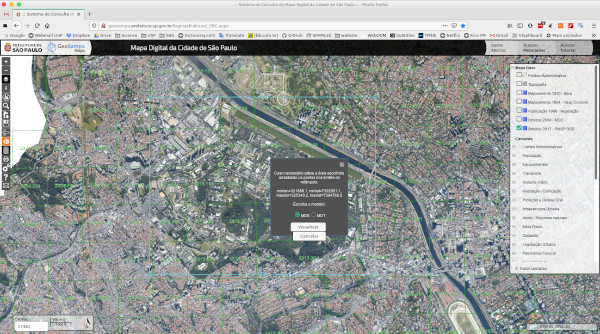
Now go to the left toolbar and click on the red icon with wavy lines (a series of topographic profiles). The icon will turn black and you can draw a rectangle over the map. A pop-up will come up with showing you the limits of the rectangle and warning that you can also adjust the limits by dragging the circles. Then you choose which model you want to visualize. “MDS” means “Modelo Digital de Superfície” (Digital Surface Model) and refers to the complete and colored point clouds (with all laser returns). “MDT” means “Modelo Digital de Terreno” (Digital Terrain Model) and will show you only the ground-classified points. Click on “Visualizar” and a new tab/window will open with a Potree viewer.
 |
|---|
| Selecting tiles for 3D viewing (click to enlarge) |
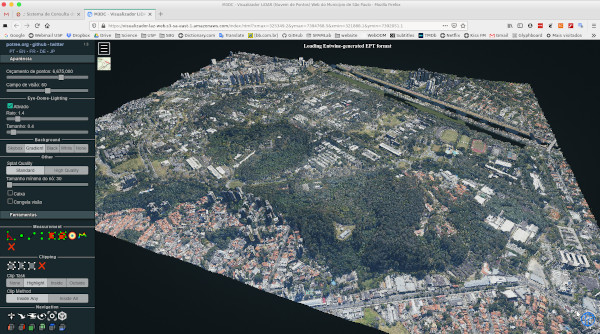
In the 3D viewer you can change the interface language ate the top left and the rest is easy. Use the mouse to navigate and zoom with the scroll wheel. The initial “point budget” of 2,000,000 points is enough for a quick view, but increase to 5,000,000 for a really nicer view.
 |
|---|
| Selecting tiles for 3D viewing (click to enlarge) |
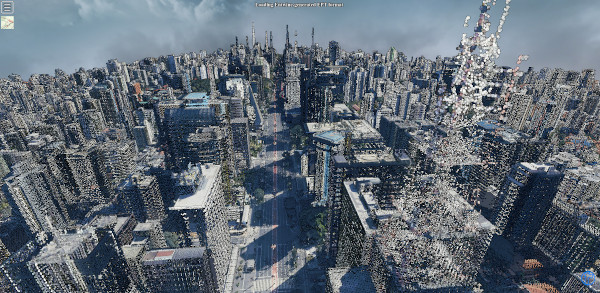
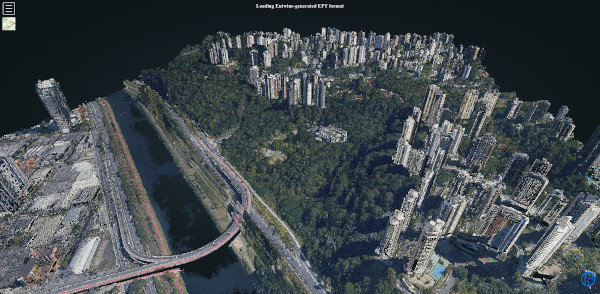
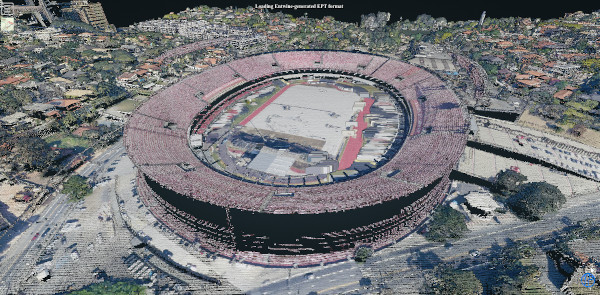
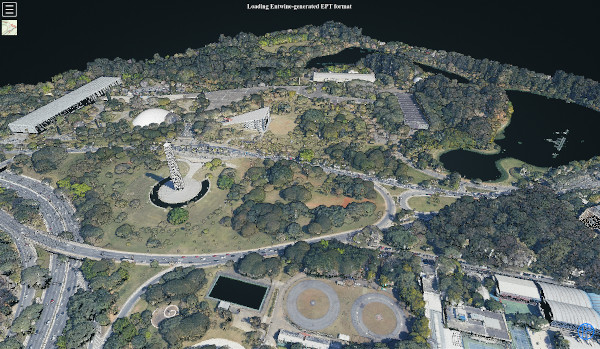
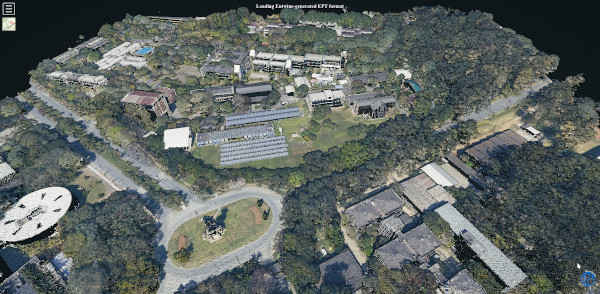
Really nice! Now, just a few images of the city for your enjoyment:
 |
|---|
| Paulista Avenue (click to enlarge) |
 |
|---|
| High-income Neighborhood (click to enlarge) |
 |
|---|
| Footbal Stadium (please don’t call it soccer… :)) (click to enlarge) |
 |
|---|
| Ibirapuera Park (click to enlarge) |
 |
|---|
| That’s were I work! (click to enlarge) |
post by Carlos H. Grohmann