Published: Nov 25, 2019 by SPAMLab
[EDIT] - this post was edited in May 2020 due to the release of new data. The process to download the data is still the same but now there is also a nice 3D viewer for the colored point clouds. See this post for a quick review of this tool.
The São Paulo City Hall has just released free LiDAR data covering the city on their digital mapping platform, GeoSampa.
The data were collect between May and July 2017, with a point density of about 10pts/m2, is referenced to SIRGAS2000/UTM Zone 23 South (EPSG: 31983) and are distributed in LAZ format.
At this time, only the ground-classified points are available, due to some limitations in the hosting infrastructure. The full point clouds with all classes are expected to be released in the near future.
Since May 2020, both the ground-classified data, as well as the full point clouds are available. The ground-classified clouds are referred in here as “MDT” (or “Modelo Digital de Terreno”, Digital Terrain Model in Portuguese) and the full point clouds as “MDS” (or “Modelo Digital de Superfície”, Digital Surface Model in Portuguese).
The GeoSampa system was made with Brazilian users in mind, so it’s all in Portuguese. To find your way into the data download, follow the next steps.
First go to http://geosampa.prefeitura.sp.gov.br. The city limits will be displayed in the center, with a base map showing the limits of the neighboring cities and the districts of São Paulo in a thicker outline. The menu panel on the right side has the available layers, and the toolbar on the left has, well, the tools to navigate, query, etc.
Scroll down the layers list on the right to the last item, “Articulação de Imagens” (Images Tiling) and select “MDT/MDS 2017”.
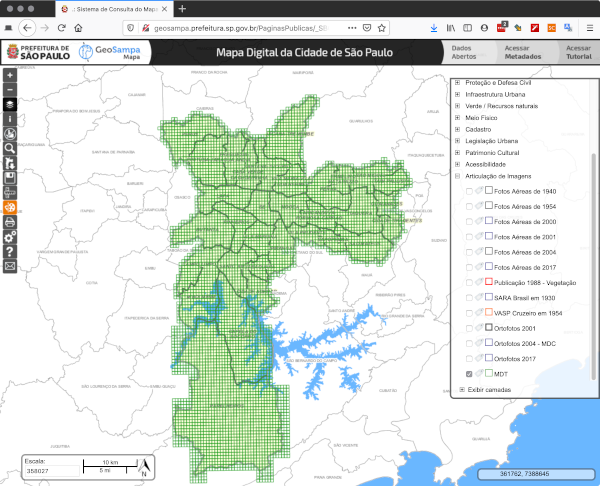 |
|---|
| GeoSampa interface with LiDAR tiles in green (click to enlarge) |
Zooming into the “Butanta” District, we can see the tiles covering the USP campus. Make note of those numbers, as the system wasn’t designed for bulk downloading, so you’ll need to request the tiles one by one.
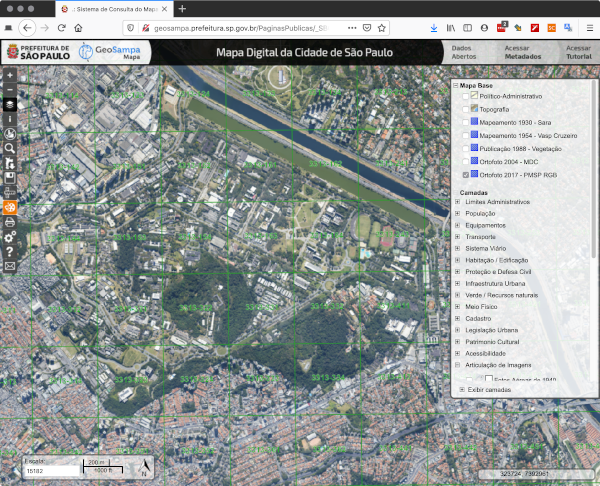 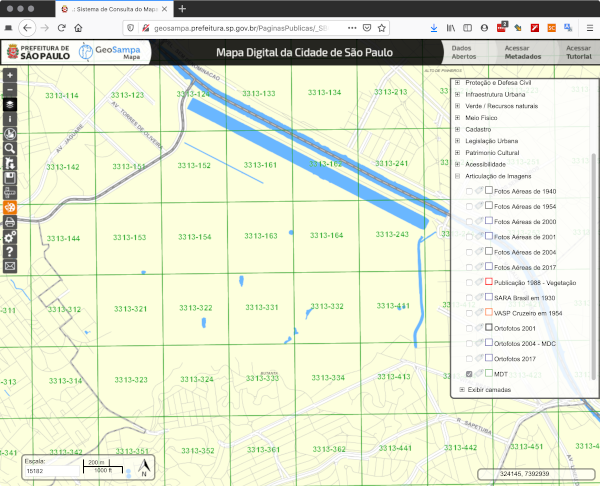 |
|---|
| LiDAR tiles over USP campus (click to enlarge) |
Click on the magnifier icon on the left toolbar and then select the “Download imagens/MDC” tab. In the left drop-down menu (“Tipo”) select “MDT 2017” or “MDS 2017” and in the field “Codigo da Faixa” start typing the number of the tile you want. The list will auto-update as you type.
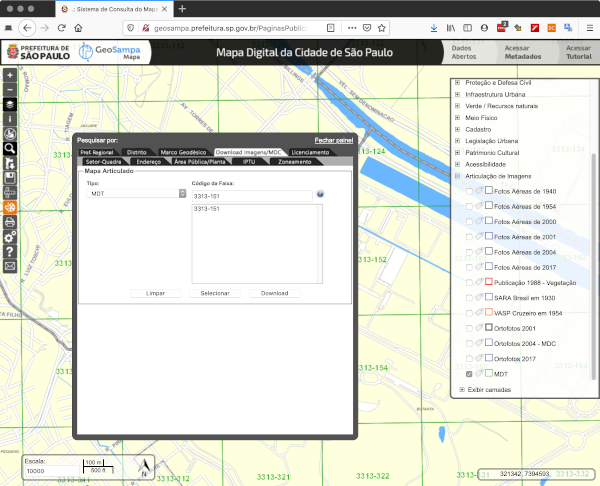 |
|---|
| Selecting a LiDAR tile (click to enlarge) |
Now here’s a tricky part: if you type the number of the tile and click over its name on the list, the system will switch back to the map interface with the tile highlighted. Clicking on this highlighted tile will open a pop-up with a download option.
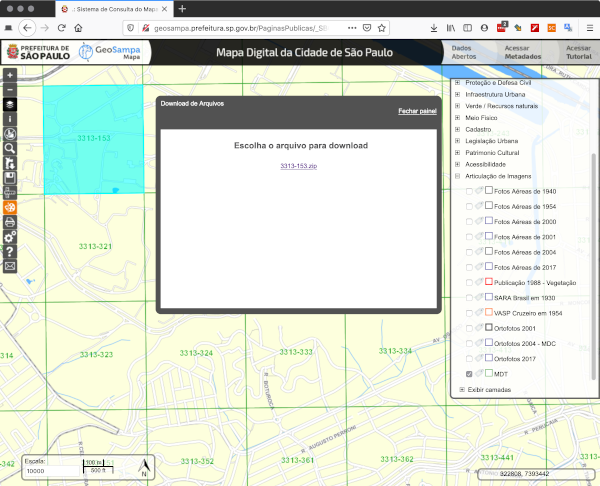 |
|---|
| Highlighted tile and download option (click to enlarge) |
A faster way to download is to click on “Selecionar”, and the download should start automatically (or you will be asked by you browser if you want to open/save the file). Then you type a new tile number to download another file.
And you do this again and again and again, for all the tiles you want. (remember when I said that the system wasn’t designed for bulk downloading? Yep.)
For this example I downloaded some 30 tiles and merged then into one file. Below you can see the whole thing displayed in Plas.io.
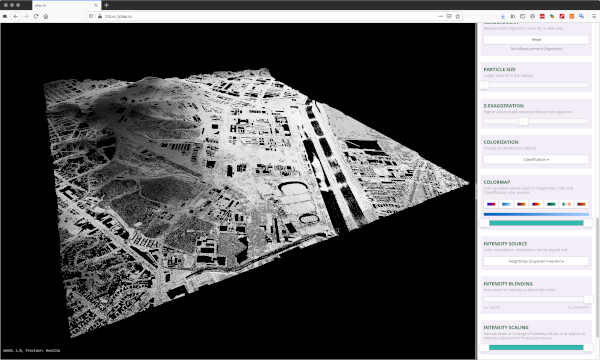 |
|---|
| Merged dataset displayed in Plas.io (click to enlarge) |
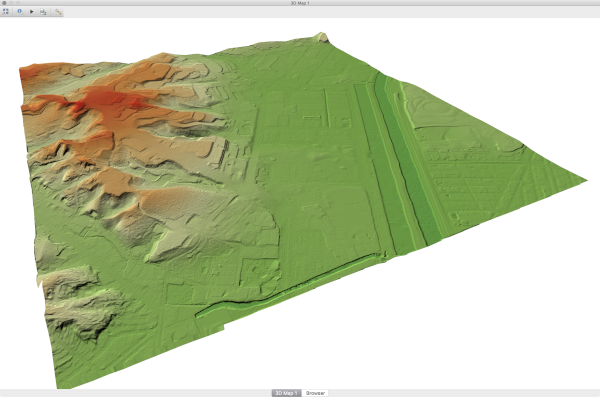
And just for fun, I converted the LAZ to an ASCII file with las2txt and opened in QGIS. Then I made a DTM with linear interpolation.
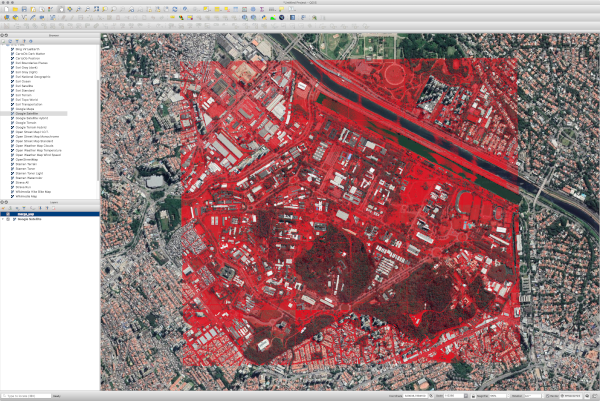 |
|---|
| LiDAR points over Google Satellite image (click to enlarge) |
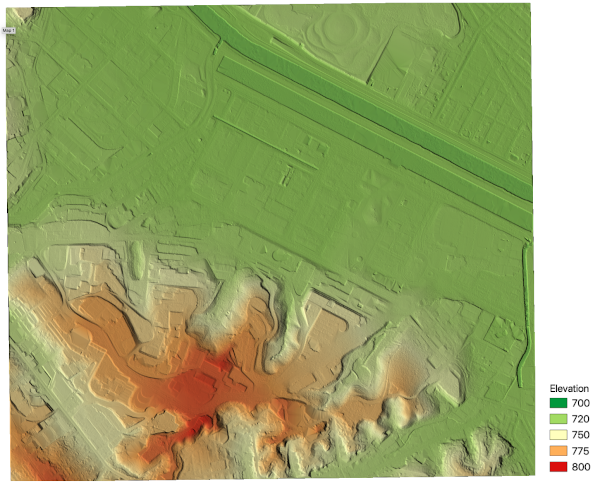  |
|---|
| LiDAR DTM in QGIS map view and 3D viewer (click to enlarge) |
Hopefully this post will help you get the data. Leave any comments below, and follow us on Twitter for updates.
post by Carlos H. Grohmann